Page 59 - Goldair_Handling_F WEB
        P. 59
     Our Workforce in Numbers
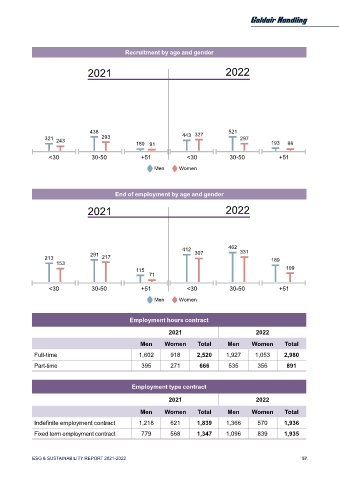
                                             Recruitment by age and gender
 Number of employees
                                2021                                            2022
 2021  2022
 22%
 workforce increase
 1,881  2,276  for 2022
                                 438                             443 327         521
 1,305  1,595    321  243            293         180 91                              297        193   98
 Total  3,186  Total  3,871  <30  30-50            +51             <30            30-50            +51
                                                       Men      Women
 Athens  Outstations
 Employees age distribution              End of employment by age and gender
 2021  2022                     2021                                            2022
 1,357
 1,168
 732  783                                                        412  307        462  331
                 213             291  217                                                       189
 353  281  476  565  435  540  191  153          115                                                 109
 176
                                                     71
 <30  30-50  +51  <30  30-50  +51  <30  30-50      +51             <30            30-50            +51
 Men  Women                                            Men      Women
 Distribution in hierarchical levels & age groups  Employment hours contract
 2021  2022                                                 2021                           2022
                                                  Men      Women      Total      Men     Women       Total
             Full-time                            1,602      918      2,520     1,927      1,053     2,980
             Part-time                             395       271       666       535       356        891
 935
 913
 809
 631
 546                                           Employment type contract
 434  313  339  416
 174  214  224                                              2021                           2022
 149  133  98  129
 12  1  13  56  28  80  15  0  15  65  25  95  96  99  Men  Women     Total      Men     Women       Total
 <30  30-50  +51  <30  30-50  +51  Indefinite employment contract  1,218  621  1,839  1,366  570     1,936
             Fixed term employment contract        779       568      1,347     1,096      839       1,935
 Managers  Administrative staff  Workforce  Drivers  Operators
 56         ESG & SUSTAINABILITY REPORT 2021-2022                                                          57
     	
